13 Creating Questionnaires and Behavioural Tasks
Although you will not be designing your own studies in RM1, you need to understand how we designed and built the projects you are working with. In future, it will be important you know how to create your own questionnaires and tasks using common tools and software once it comes to your dissertation and as a future employability skill.
The key principle to keep in mind is this is a measurement problem. As psychologists, we want to investigate human behaviour and to do that we need the most valid, reliable, and pragmatic measure of human behaviour. Sometimes that will be a questionnaire or survey, other times it will be a behavioural task. It is important you know first how researchers create them and second how you can make them yourself.
In this chapter, we outline common tools and software you will have access to or will hear about, then explain some key principles in creating questionnaires, behavioural tasks, and considerations for collecting data in-person compared to online.
13.1 Common tools and software
There are a range of common tools you will come across as you read journal articles and talk to different lecturers. One of the most important considerations though is making sure any tools and software are GDPR compliant for data protection. When it comes to your dissertation, your supervisor will help with this. In this course, all the tools we recommend are GDPR compliant. As a starting point, the university maintains a software and online tools page which outline all the major approved services. Just note that not all of the tools we outline below are included on this site as the page is mainly about the services that the university purchases.
Microsoft Forms
This Microsoft product is included in everyone’s Office 365 suite. It is one of the university’s preferred tools and we recommend using it for simple surveys. You can ask for free text responses or pre-set response options like select a category or rating scales.
Qualtrics
This is possibly the most common survey platform you will come across within universities and across different workplaces. It is incredibly popular for market research and feedback, so you will come across it even if you do not want to work in academia. It has more advanced functions than Microsoft Forms and it is what we use for the projects in RM1. You can add features like randomisation and branching between questions which makes it great for psychology research.
Gorilla
Gorilla is an online experiment platform where you can create both surveys and a range of behavioural tasks. You can create simple experiments using the builder interface or with some Javascript programming, you can make incredibly complex experiments. If you just want to make surveys, then you are better off using Forms or Qualtrics. However, if you need behavioural tasks or build experiments alongside survey questions, it is probably the most user friendly tool to create online studies.
PsychoPy
PsychoPy is a piece of software for developing behavioural tasks or experiments. It it based on Python, so you can either interact through the user interface or write Python code to build experiments. The software is local to a computer to collect data in-person or you can integrate it with their Pavlovia system to run experiments through a web browser.
OpenSesame
OpenSesame is very similar to PsychoPy where it is a Python-based experiment builder featuring a user interface or the possibility to write Python code. There is also an online platform called OSWeb to run experiments in a browser. The two tools are very similar so it is more down to personal preference or what your supervisor already uses.
Matlab
Matlab is a programming language for generating experiments, stimuli, and analysing data. The university provides access and many researchers have experience using Matlab over Python or PsychoPy. It is popular in brain imaging research due to extensive libraries supporting processing pipelines, but again it will be down to your supervisor’s experience for whether they would support you using Matlab for a project.
Prolific
One further tool you will hear about is Prolific - a participant recruitment service. In contrast to the previous tools, you do not create studies within Prolific, but integrate it with something like Gorilla or Qualtrics. You pay participants and select inclusion criteria from their participant pool and direct them to your study via a URL. Prolific has become one of the most popular recruitment services as it is GDPR compliant and recognised for higher participant quality. Many psychology studies use something called Amazon Mechanical Turk but it is not approved by many UK universities and the participant quality can be questionable given the far lower payment guidelines.
13.2 Questionnaires and scales
One of the most common ways of measuring human behaviour is through questionnaires or surveys. These rely on self-report for participants to select a response most consistent with how they are currently feeling or identify with. Survey studies normally consist of one or more psychometric scales, demographic questions to record participants’ characteristics, and potentially free-text responses.
13.2.1 Scales
The idea behind scales is that you can measure an element of human behaviour by inferring a construct or latent variable through responses to multiple items. These are often in the form of Likert scales where participants indicate agreement or disagreement to an item. Often this will be on a 1 to 7 scale where 1 corresponds to strongly disagree and 7 corresponds to strongly agree. Across the items, you then take the sum or mean of each item to create an overall scale score. The response options and summary statistic for the scale score varies from scale to scale, so it is important you find and refer to the instructions and scoring information.
Valid and reliable measures
Psychometric scales are carefully designed to measure an element of human behaviour in a valid and reliable way. It takes a lot of time and participants to validate a scale and we could easily dedicate a whole course to psychometrics. If you want an introduction to the stages involved in scale development, we recommend Boateng et al. (2018).
You do not want to make up your own scales on the fly, so you are looking out for measures described and cited in previous studies. They will normally cite a validation article where authors describe the steps to create and validate the scale. For example, Alter et al. (2024) validated a new scale on the value of software to statistical learning. They started with 10 items and identified the most effective 7 items. They demonstrated the internal consistency of items to measure the construct and evaluated how it compares to similar measures.
For example, one common scale for measuring depressive symptoms is the Center for Epidemiological Studies-Depression(CES-D). You can then find the items and scoring information via the APA. Participants are prompted with instructions “Below is a list of the ways you might have felt or behaved. Please tell me how often you have felt this way during the past week” and they respond to 20 items, such as “My sleep was restless”. Participants then have four response options:
Rarely or none of the time (less than 1 day )
Some or a little of the time (1-2 days)
Occasionally or a moderate amount of time (3-4 days)
Most or all of the time (5-7 days)
For this scale, you take the sum of the items where the options relate to a score of 0 for the first response and a score of 3 for the fourth response. The lowest possible score is 0 and the highest possible score is 60, with a higher score indicating more severe depression.
This chapter explains the principles behind the instructions and items behind a scale. In the accompanying lab / weekly activity, you will learn the practical side of recreating a scale in Qualtrics.
Finding scales and restrictions
For academic research, you normally find the items and instructions in validation articles. The authors put in the work to develop the scales and you cite the article to acknowledge the source and credit. However, prepare for detective work to find all of the information. Not all validation articles provide all the instructions, items, and/or scoring instructions. Sometimes you will need to search the name of the scale and find information from other researchers.
Relatedly, one thing to be aware of is that you can freely reuse most academic scales and cite the authors for acknowledgement. However, some scales (particularly diagnostic tools) have quite restrictive licences meaning the creators expect you to pay for using the scale. This is normally quite obvious when searching for the details of scales. We would never expect you to pay for using scales, so if you are ever unsure about the restrictions on using a scale, make sure you discuss it with your supervisor or course lead.
13.2.2 Demographics
A psychology study often includes a one or more demographic questions to contextualise your sample for reporting, or they might be included as key predictors in your study. It is normally a good idea to put demographics at the end of your study before the debrief to avoid influencing other responses and making sure people respond to the key scales or tasks first.
The main consideration is what demographic questions to include. Common options are age and gender, but it depends on the topic of your study for what demographic information would be useful to report. You do not need to collect every piece of information you can think of as it will waste your and your participant’s time if you are not going to use it. See what similar studies report as this will help compare your sample characteristics to the studies that influenced you, and consider what demographics are relevant to your study and research question.
The other consideration is making sure the demographics are inclusively and respectfully worded. For concepts like gender and ethnicity, you will see large variance in the categories available to participants, particularly in older articles. Take gender, it is normally a good idea to make it optional for people to respond to the question “What gender do you identify with?” and providing inclusive options over binary man/woman, such as:
Woman
Man
Non-binary
Other (and allow people to type a free-text response)
Prefer not to say
13.2.3 Free-text responses
Instead of pre-set responses participants can choose from, you can also ask people for a free-text response to a given question. This could be asking someone a simple question like how old they are in years which takes two characters or it might ask for a longer typed response in a qualitative or mixed methods survey. Like demographic questions, it is just a question of thinking about what you need to address your research question to make sure it is worth your and your participant’s time. You will learn more about designing questions and studies for qualitative methods in RM2.
Add validation criteria
One mistake you often learn about the hard way is recognising how participants can make mistakes in the questions you give them. For example, if you want people’s age in years and you give them a free-text box, could they type that in words and cause you data processing headaches? In James’ PhD, one of his free-text responses asked participants how many cigarettes they smoked per day but some people’s internet browsers would autocorrect it to a date, messing up how it was read into R.
To solve this, many tools like Qualtrics let you set validation criteria for what information is allowed in a box. For example, it must be a valid email address, or it must be numeric with minimum and maximum allowed values. Try and take advantage of this validation criteria to avoid headaches further down the line.
13.3 Behavioural tasks and experiments
In contrast to self-report questionnaires, another way to measure behaviour is through behavioural tasks or experiments. You will come across tasks all the time in behavioural psychology research, but here we loosely define them as any task or experiment where you manipulate stimuli over multiple trials and record responses. We do not have time to teach you how to create them yourself in this course, but we explain how people design them and provide some examples to help you understand the method sections of articles. We then provide some recommended resources to learn more which might be useful to refer back to if you need it for your dissertation.
13.3.1 The Stroop task
To help explain the idea, the most famous example of a behavioural task is probably the Stroop task. In each trial, participants see a word relating to a colour (e.g., Blue or Red) in the middle of the screen. The researcher manipulates the font colour of the word to either be congruent or incongruent. For example, the word Blue written in blue in a congruent trial:
Blue.
Alternatively, the word Blue written in red in an incongruent trial:
Blue.
In each trial, the participant must indicate the font colour of the word as quickly as possible using the keyboard. Over tens or hundreds of trials, the participants completes all the variations of words and whether the font colour is congruent or incongruent. What you tend to find is that on average, participants respond quicker to the congruent words than the incongruent words. The explanation is that there is a Stroop interference effect as reading the word is quicker than processing the font colour, so incongruent trials take additional processing time to respond.
This is the basic idea behind a behavioural task. You want to measure some kind of human behaviour, so you use a behavioural task to manipulate stimuli and measure responses to tap into that behaviour. In contrast to questionnaires which rely on self-report and introspection, behavioural tasks are trying to measure behaviour people may not be consciously aware of, like the subtle processing difference between congruent and incongruent colours.
There are many somewhat standardised tasks out there that have been designed to measure different elements of human behaviour, so like questionnaires, it is not usually a good idea to simply make up your own as you want it to be valid and reliable. This means you must understand how researchers report the tasks they use to potentially recreate yourself.
Try this
If you have not tried the Stroop task before, you can complete a demo in your web browser via PsyToolKit. In the demo, you complete 40 trials and it will tell you your average response time to congruent and incongruent trials to show the Stroop interference effect.
13.3.2 Understanding the design of tasks
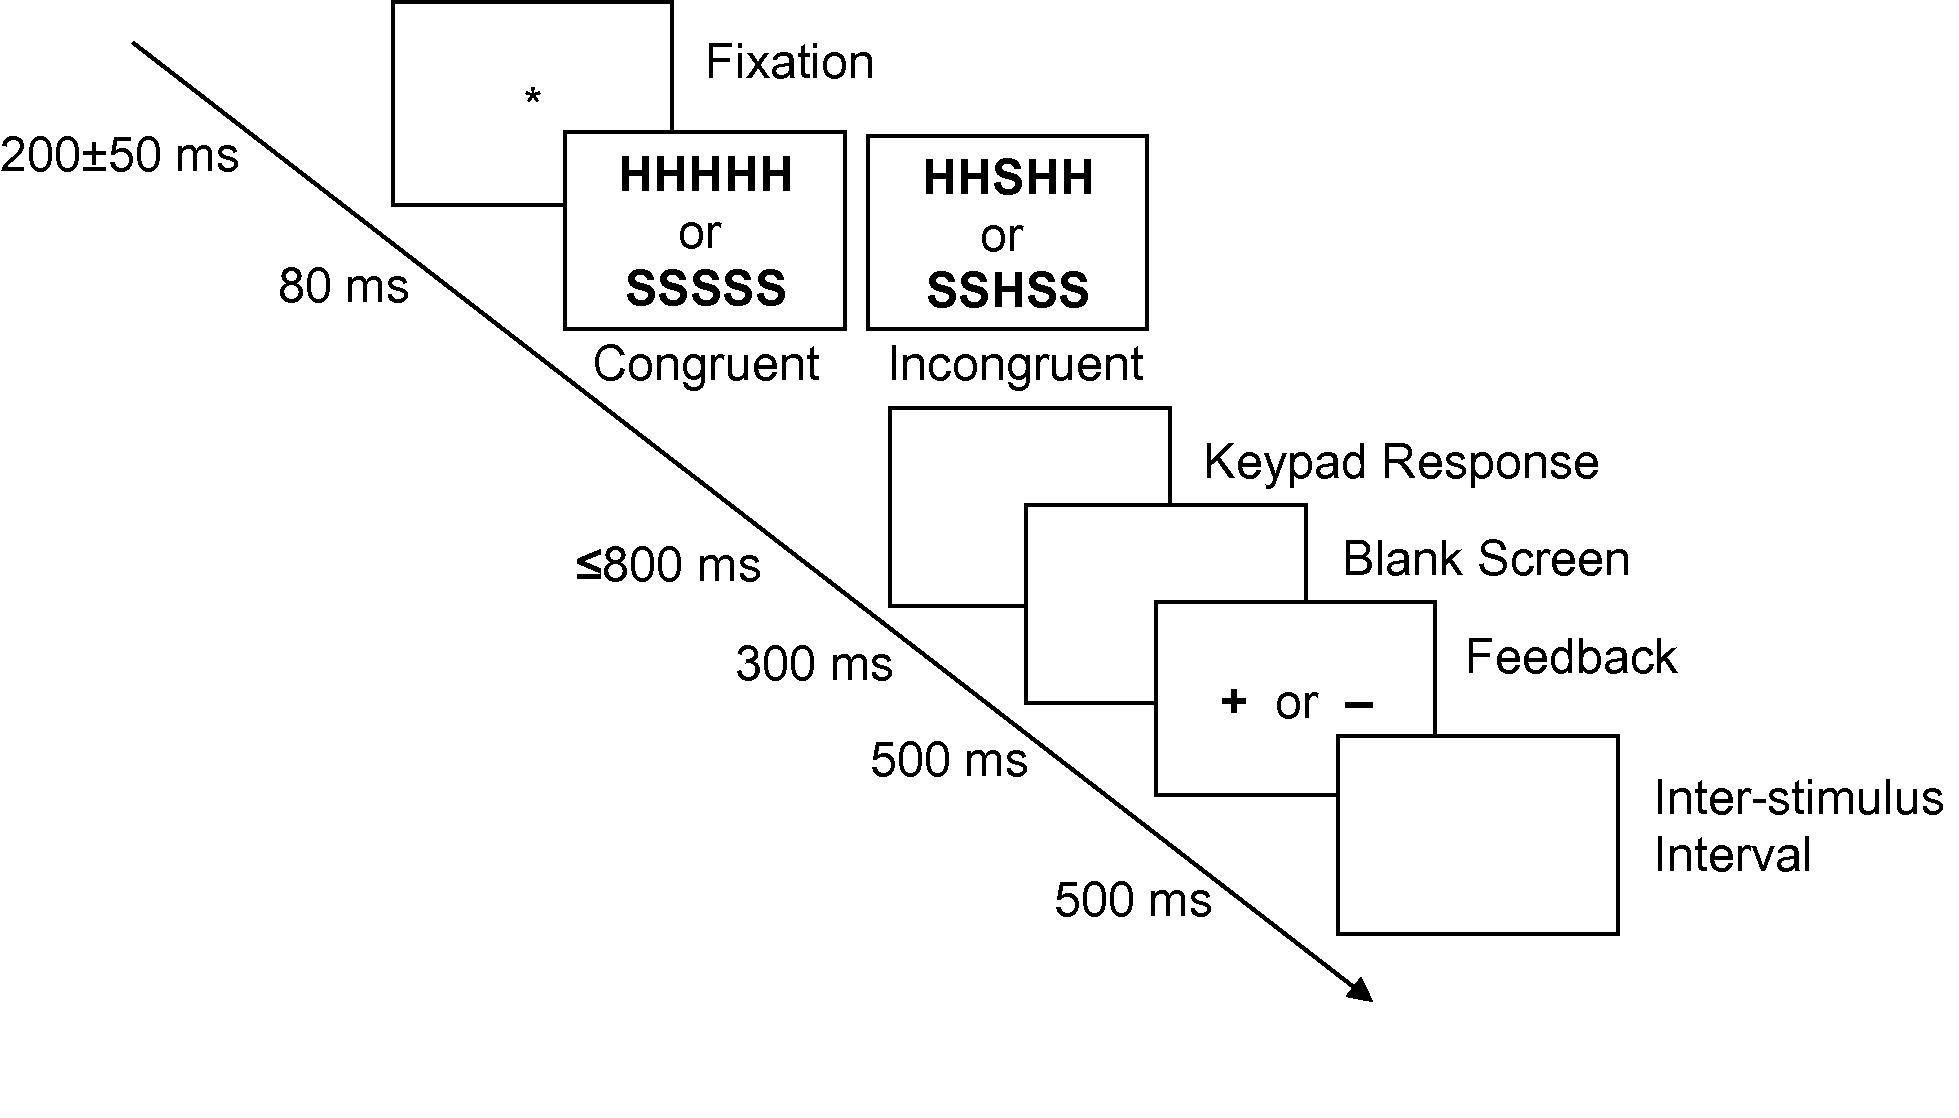
Now we have walked through the Stroop task which many people have experienced, imagine you identified a task you want to recreate from a published paper but you have not completed one yourself before. Where do you find out how to create them? In all empirical psychology articles, there will be a method section outlining how the authors conducted their study. If this is written well enough (and in an ideal world, they should share their task script or design in their supplementary materials), it should allow you to recreate their study as close as possible. In many studies that use behavioural tasks, the authors provide diagrams of their task design, such as Figure 13.1 from an EEG study by Rass et al. (2014).
This is called the Eriksen Flanker task. It follows a similar principle to the Stroop task as it aims to measure the impact of interference on task performance. However, instead of looking at word colour, it uses distracting information. The aim of the task is to identify the middle letter in a five letter string (there are many variations of this, such as using arrows instead of letters). The four outer letters are distractors, and on some trials they are congruent, and on others they are incongruent. Studies usually find that response times are slower in the incongruent condition than the congruent condition.
We will go through the diagram above step by step to decode the design. In this experiment, a trial consists of a central fixation cross which stays on the screen for a random interval between 150-250 milliseconds (ms). This randomness is usually introduced to stop participants just mindlessly clicking buttons to predictable stimuli. A stimulus then appears on the screen for 80ms. This period is sometimes called the Stimulus Onset Asynchrony (SOA), or for how long the stimuli remain on the screen. There are two conditions for the stimuli: congruent (HHHHH or SSSSS) or incongruent (SSHSS or HHSHH). For this task, the participant must identify the middle letter by pressing either the letter ‘s’ or ‘h’ on the keyboard. After the stimulus has disappeared, there is a blank screen where the participant has up to 800ms to provide a response. After the response, a blank screen is presented for 300ms. The participant is then provided feedback to let them know whether they pressed the correct button or not. A ‘+’ is shown for a correct response and a ‘-’ is shown for an incorrect response. Finally, an inter-trial interval (ITI; although confusingly this is called an inter-stimulus interval despite indicating the end of a trial) is shown on the screen for 500ms to indicate the end of a trial.
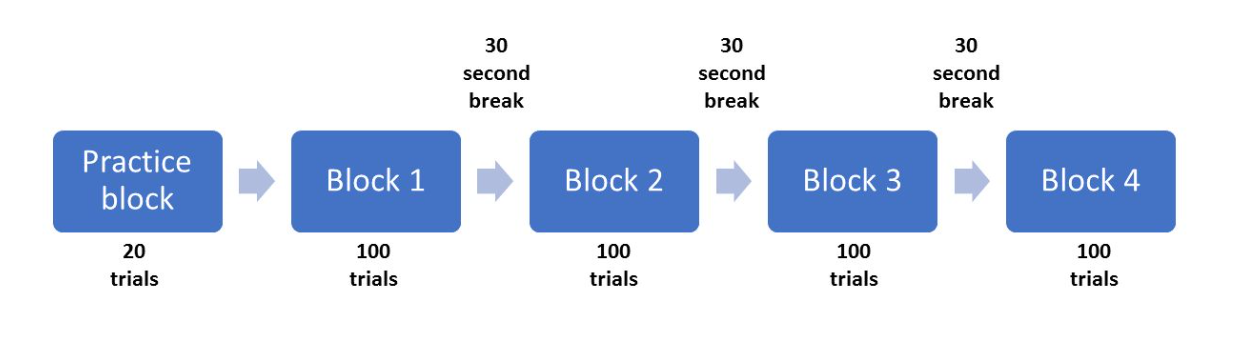
Now that we know how one trial is structured, we can see how many times this is repeated to form a block of trials. In the method section, there are more details about how many trials are included. For the participants to understand they are completing the task accurately, they complete 20 trials in a practice block. The authors then explain that participants completed four blocks each containing 100 trials for a total of 400 trials. Between each block, there is a rest period for the participant, but it does not say how long this period is. For demonstration purposes, we will say they receive a short 30 second break. Finally, we know that there are an equal number of congruent and incongruent stimuli in each block. As we have two types of congruent and incongruent stimuli, we can take a good guess that each one of these is presented 25 times in each block. The authors provide us with a diagram of each trial, but we can visualise the structure of the whole experiment like Figure 13.2.
This is the amount of information you need from an article to enable you to recreate the task the authors used. This is a good example with the only missing information being the duration of the breaks; a relatively minor detail. You should be prepared to come across substantially less helpful authors that do not provide sufficient details. This is usually the case when it comes to tasks that use images. Researchers do not normally share these and often do not even describe them. Hopefully, this will also demonstrate the importance of fully describing your experiment in a report or dissertation. Try and imagine you are the other researcher trying to recreate the task from your instructions.
Try this
In the previous chapter, we invited you to read the method section (pages 2 and 3) of Registered Replication Report: Testing Disruptive Effects of Irrelevant Speech on Visual-Spatial Working Memory by Kvetnaya (2018). At that point, the materials, design, and procedure might have been quite difficult to follow. Now we have explained the basic principles of breaking down behavioural tasks, try and revisit Kvetnaya’s method section to see if you can understand how they designed and presented their task.
13.4 Online vs in-person data collection
Finally, we have the choice between online or in-person data collection in relation to designing questionnaires and behavioural tasks. Historically, behavioural tasks were restricted to a physical lab room due to technological limitations but over the last 10 to 20 years, you can easily administer questionnaires and tasks via a web browser. This means the choice is now about participant access and data quality rather than technical limitations.
If you want to collect data in-person, you are relying on people who live in close proximity to the university and who have the time and motivation to complete your study. Often, these will be university students through something like a participant pool. This means you might only have access to a specific sample which might be a problem depending on your target population. On the other hand, you might have access to fewer participants in total but your conversion rate for participants who start and complete the study will often be much higher. You also have more control over the environment and number of distractions available to the participant.
In contrast, online studies potentially provide a much larger potential source of participants as there are no geographical or physical restrictions. In theory, anyone can complete your study in their own time once they have a link. If you are targeting a specific sample / population, then you potentially have access to a larger pool of potential participants. However, you have much less control over who is participating in your study and the data quality they provide. Since participants complete the study in their own time and space, you have no control over potential distractions or whether they actually meet your inclusion criteria. The conversion rate is often much lower in an online study too as people can start the survey and if they get bored, simply close the link.
There is no universal right answer for which method of data collection is best, it depends on the pros you desire and the cons you are willing to accept. This is all part of the research design process to weigh up the pros and cons, so you recognise and accept potential limitations from the start. It just means you must consider the wider concept of data quality, such as verifying participants, attention checks, and manipulation checks. Note we are not going to provide a literature review for each concept, just outline what they are before we provide a list of further resources for future reference.
13.4.1 Participant verification
When we conduct psychology research, we want to learn about human behaviour. This means one of the key considerations is making sure real participants are completing your study. When you share a study link online - particularly when there is payment involved - there is the potential for bots to complete your study. This is where people create computer programs to complete questionnaires and tasks, and enter information. Some tools such as Qualtrics include security settings you can activate to detect bots and repeat submissions using things like reCAPTCHA (think of when you access a website and you need to select all the images containing a car). With the rise of generative AI tools, this adds another potential verification issue as people can outsource the study to enter information from something like ChatGPT.
To verify participants, you can ask for free-text responses to some questions or upload files for which generative AI tools (currently) find more difficult. For recruitment services like Prolific, this is another way of verifying participants as everyone in the pool provided an ID check when they signed up and they are developing tools to deter participant generative AI use.
13.4.2 Attention checks
Data quality is not a unique problem to online studies. Participants can mindlessly scroll and click through studies, so one strategy is including attention checks to potentially use as exclusion criteria. For example, people periodically embed a question within scales which will say something like “for this question, select the option 5”. For people who do not respond 5, you suspect they were not reading the questions carefully and did not follow the instructions. Other strategies include asking people to self-report their data quality for whether they completed the study properly or excluding people if they completed the study quicker than plausibly possible.
13.4.3 Manipulation checks
Somewhat related to making sure participants are paying attention while completing your study, you might also check whether they have been influenced in the way you intend by some kind of manipulation. For example, James worked on a study about predicting unethical workplace behaviour. Participants were randomly allocated into different conditions to manipulate things like a high or low quality workplace in a vignette. We asked people a series of questions to see if they recognised the manipulation such as “how would you describe the quality of the workplace?” with options including good, neither good nor poor, or poor. You do not necessarily need to exclude participants who fail the manipulation check but it is one way to investigate the efficacy of your manipulation which can help interpret your findings.
13.5 Further resources
Given you do not create your own study in RM1, we do not expect you to spend the time learning how to do all of this stuff yourself now. So, we end on some further resources to learn about data quality in online studies and creating behavioural tasks which might be useful later in your journey, such as when you are starting your dissertation.
13.5.1 Data quality in online studies
Prolific have a series of resources for creating online studies and one explains How to improve data quality in online studies. It explains things like verifying participants, performing attention checks, and AI detection.
Experimentology by Frank et al. is an excellent online book on an open science approach to experimental psychology methods and they have a chapter on Data Collection. They extensively explain best practices for online and in-person data collection and cite a wide range of sources you can refer to.
13.5.2 Creating behavioural tasks
It is possibly a little out of date now, but James wrote a guide to Creating Experiments using OpenSesame.
In the reading list for RM1, we have included a link to Building Experiments in PsychoPy (2nd edition) by Peirce et al. (2022) which you can access via the library. This books explains how to create behavioural tasks using PsychoPy.
Similarly, we also included a link to Python for Experimental Psychologists (2nd edition) by Dajmaier et al. (2024) which also demonstrates how to code experiments and analyses using Python and PsychoPy.
This video by Xiaojin Ma is quite long, but it walks through Using PsychoPy to build a cognitive psychology experiment from scratch.